Once the markets on which a technology can be applied have been identified (see the article: Exploring the market segmentations of a technology), it is interesting to launch a search by sector with the same keywords and possibly a list of players.

Within each of these cartographies, look at the relationship graph on the Dashboard to compare the distribution of relationships found in relation to each of these markets. This will allow you, for example, to identify the most competitive market, which one is likely to be the most mature, or the one with the most partnerships or investments (capital relations).

Based on the analysis previously carried out, you will be able to draw up a graph to visualize and compare the state of your markets.

Secondly, you can compare the top players in each of these markets to identify companies that are positioned in several markets at once ; or pure players that are mainly focused on one of them.
To do this, go to your Dashboard to see the Top 10 players with the most relationships. Using these charts you can easily identify the leaders in each of these segments.

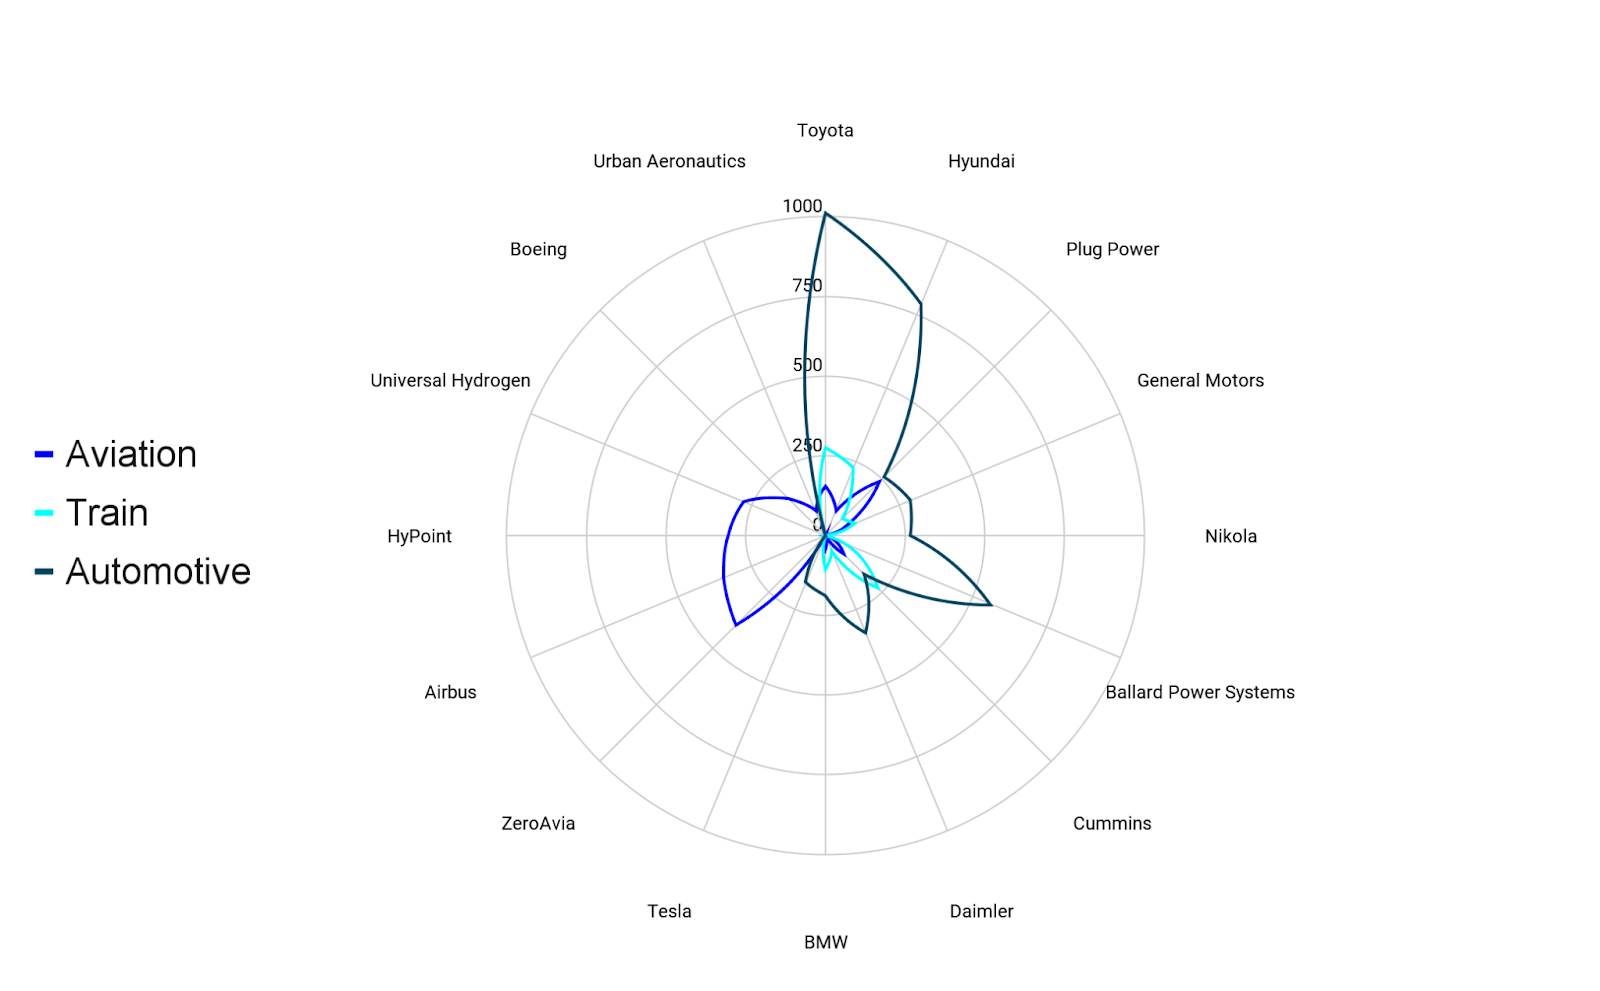
To complete this analysis, you can create a positional radar of the players in each market. This will make it even easier to identify leaders, followers, and players focusing on one or more markets at a time.