
Data visualization allows you to present data in a variety of ways to best meet your export and analysis requirements.
-----CONTENTS-----
The different types of bar chart
Cumulative bar chart
Comparative bar chart
Hide ecosystem" activation
Change metric
Exclusion (cumulative view)
The different types of Bar chart
Cumulative Bar chart
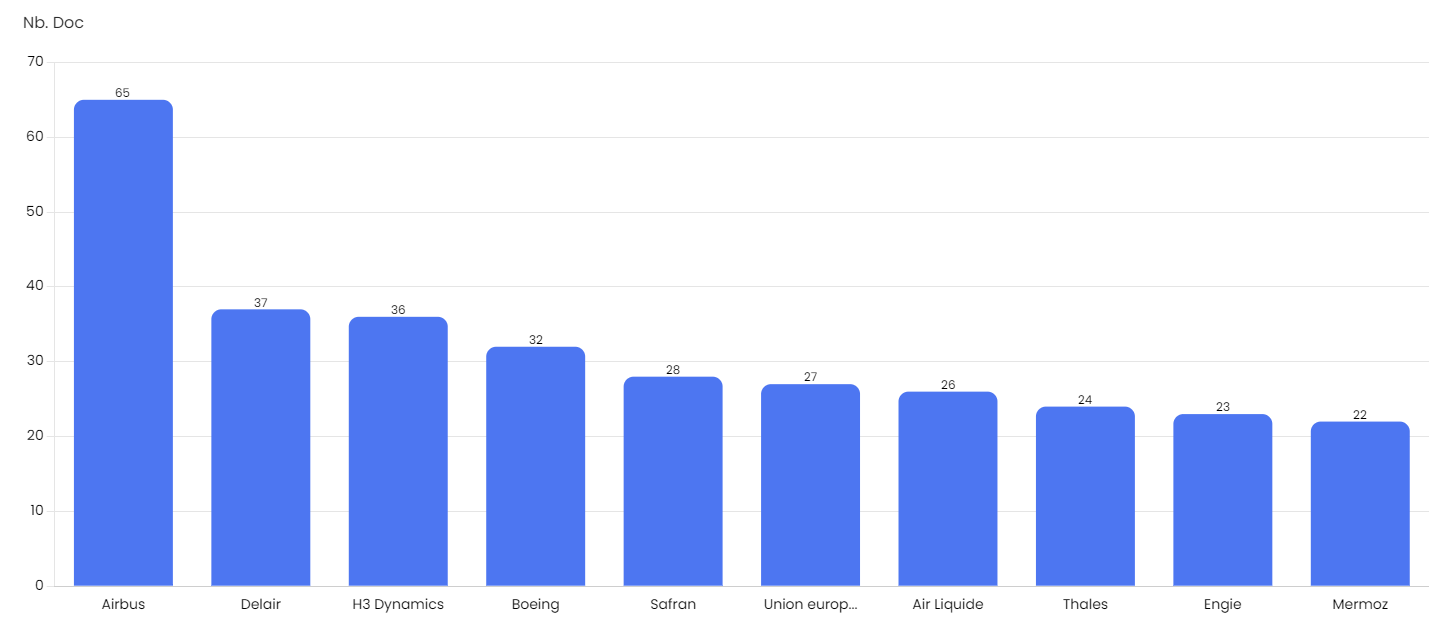
The Cumulative Bar Chart gives you an at-a-glance view of the 10 most cited entities within the documents related to your search topic.
The Cumulative Bar Chart adapts according to the filters selected: a bar representing the number of documents for an entity meeting all the selected filters.
Clicking on a bar opens the document panel, displaying the documents related to the entity and the selected filters.
Compared Bar chart
The compared bar chart lets you analyze several entities according to independent criteria: each bar represents a filter for one entity.
For this view to appear, you must :
- Click on "Options" at the top right of the widget, then on "Compare".
- Select at least one relationship, keyword or country in the filters to start comparing your entities.
Clicking on a bar will open the document panel, displaying documents related to the entity and filter represented in that bar.

![]() Tip: first select the entities you wish to compare before playing with the filters
Tip: first select the entities you wish to compare before playing with the filters
![]() Tip: for your view to make sense and to facilitate your analysis, select only one type of filter
Tip: for your view to make sense and to facilitate your analysis, select only one type of filter
Options
"Hide ecosystem" activation
If you wish to display in the Bar chart only the selected category or entity (and not its ecosystem), select the 'Hide ecosystem' option. The Bar chart will display only the selected category/entity.


Metric change
You can view your graph in terms of number of documents or number of relationships. To do this, click on "Options" in the top right-hand corner of the widget and choose the metric you need, then the graph will update.

Exclusion (compared view)
Only available for cumulative views, you can click on the labels in the widget legend to exclude data from the view: in the example below, Canada has been removed, so the Canada bar will not appear in the widget but will remain in the filters.
