- Frequently Asked Questions
- Geotrend's Layouts
- Our Relations layout
Ecosystem - Pie chart view
Data visualization allows you to present data in a variety of ways to best meet your export and analysis requirements.
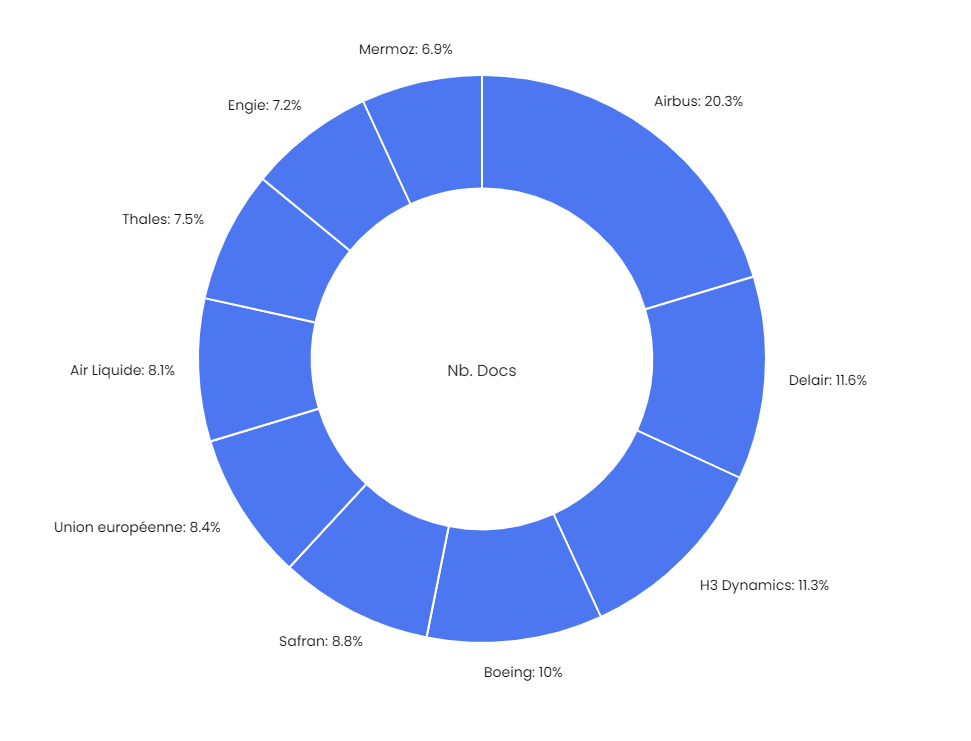
The Pie chart provides an overall view, in percentage terms, of the 10 most cited entities in the documents.
Pie chart adapts to selected filters.
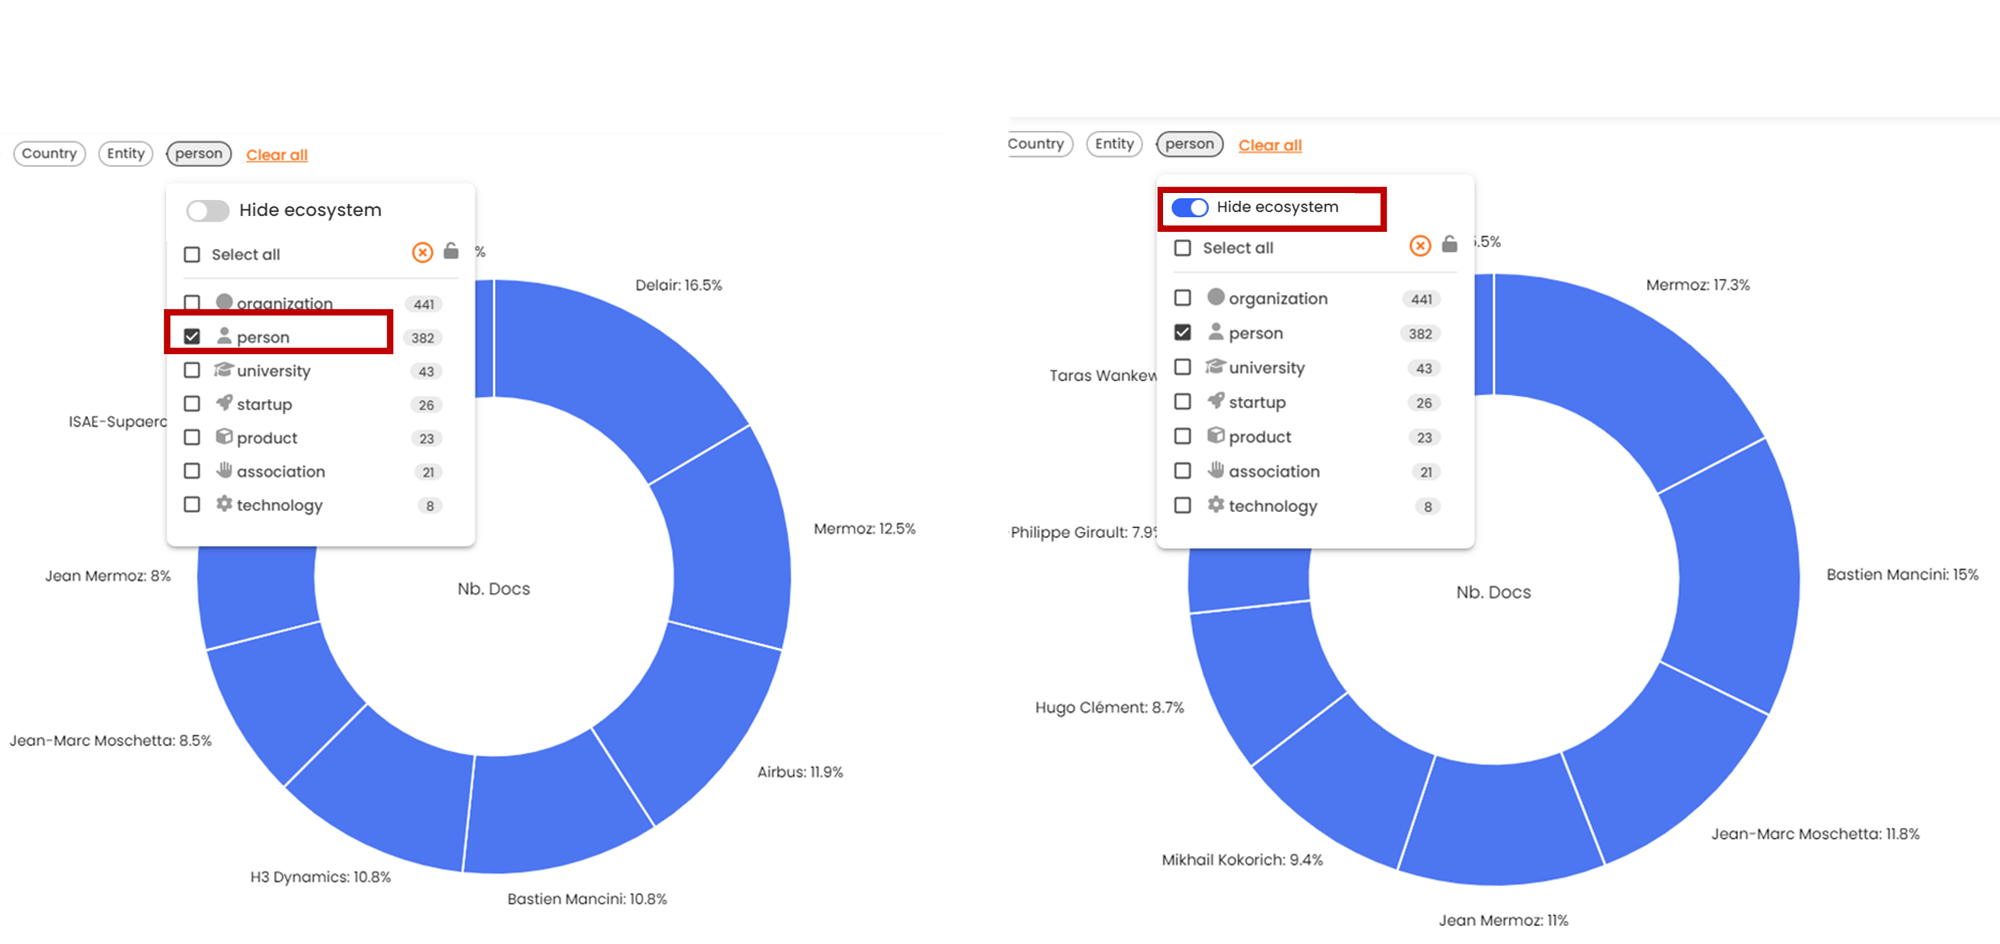
Activate "Hide ecosystem"
If you wish to display only the selected category (and not its ecosystem) in the Pie chart, select the "Hide ecosystem" option. The Pie chart will display only the selected category.