
Geotrend offers you a visual representation of the most important information of your research, allowing you and overview and a better understanding of your ecosystem.
Profit from a gain of productivity thanks to a simplified analyses of the key information for each search you produce. You can find, via the Dashboard, all the essential information of your research, synthesised in a unique view.
You can also detect the important trends connected to your issue, the main actors, but also the key relations of the different ecosystems linked to your research.
By default, you start with this view when you click on a research. During your way through the different views offer by Geotrend, you can come back to the Dashboard at any time just by clicking on the dedicated button on the left of your screen  .
.
The different units
In order to analyse your results in an optimal way, different units are displayed.
-
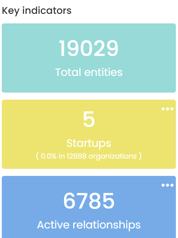
The key indicator unit
-
-
Total entities shows the total number of entities found in the research (organisation, product...).
-
Start-up indicates the number of start-ups detected in the research. It gives you the percentage of start-ups overall (company, group, association...).
-
Active relationships indicate the number of relations given as "actives", meaning the number of relations qualified* connected to an entity.
* all the relations except "other"
-
-
The top Entities unit
Shows you the top 10 players in your search. This one is based on the number of relationships and aims to help you evaluate the size of an ecosystem on a player (the more relationships he has, the more active he is on his sector).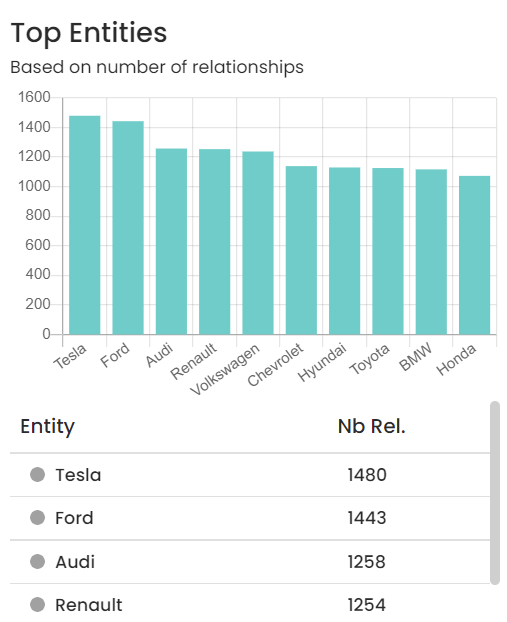
-
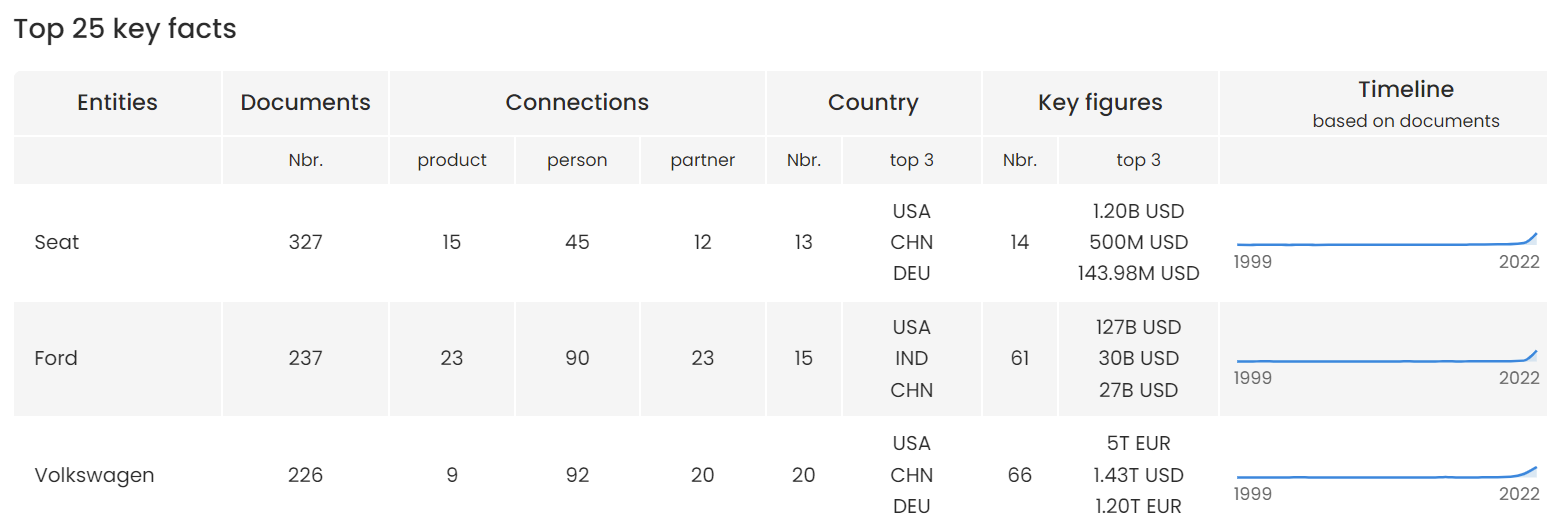
The top 25 unit
Shows you the top 25 entities based on the number of documents. It allows you to evaluate the visibility and notoriety of an actor (the more it is cited, the more important it is in its sector)
-
-
The "Documents" column shows the number of documents in which the actor is cited.
-
The "Connections" column shows the number of products, public persons and partnerships linked to the actor.
-
The "Country" column shows the number of countries in which the actor is cited and the top 3 in terms of the number of documents citing it.
-
The "Keyfigures" column shows the number of transactions in which the actor is cited and the top 3 in order of size of the transaction.
-
The "Timeline" column shows the number of documents by publication date
-
This module is fully clickable and allows to automatically apply the related filter(s).
-
The Relationships unit

This shows you the percentage distribution of the relationships detected in your search.
You can use the filter bar via the relationships filter to decide to hide one or more relationships in this graph.
You can visualise for each entity the potential partners, main competitors, most important investors and potential suppliers.
Those four units allow you to visualise directly the "Top 10 entities" who count the biggest number of relations of the same type with other entities.
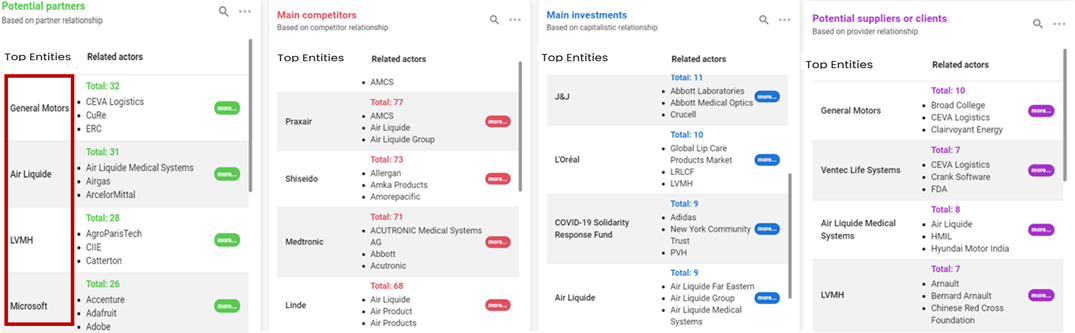
By hovering over the more button, the full list of linked actors will be shown. In order to see more than the "Top 10", click on ![]() . This will enable you to see the full list of actors presenting such a relation and identify with whom. You can also do a search via the button
. This will enable you to see the full list of actors presenting such a relation and identify with whom. You can also do a search via the button ![]() .
.
For each entity, the total indicator represents the number of relations of the same type with another other entites.
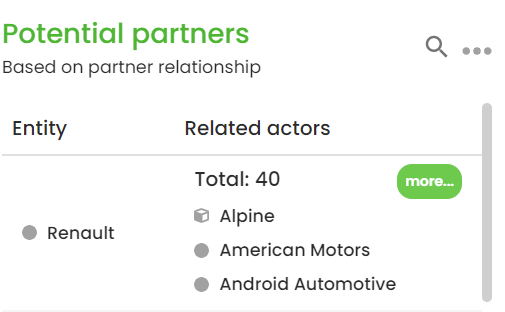 In this example, General Motors has 32 relationships qualified as "partners" with the actors CEVA Logistics, CuRe, ERC...
To display more entites, click on the button  (actors are classified by alphabetic order).
Filters usage
Note that all the Dashboard's units adapt themselves according to the selected filters. When no data is available with the selected filters, the unit will display this message:

This also applies for the monitoring steps. This way, you have the guarantee that your Dashboard is always updated.
Customise my Dashboard
You have the possibility to organize your Dashboard as you wish.
Indeed, each module can be moved according to what you want to see first
To do so, you just have to enter the module and move it where you want.
Monitoring
When you are in a monitored research, you will find on the "Top Actors" and "Relationships" module a column named "Differences". This column indicates with an arrow the increase or decrease of the number of references associated to each actor or relationship. The evolution of the number of documents is also given with a percentage next to the arrow. This way you can follow trends on your market and actor’s strategy.
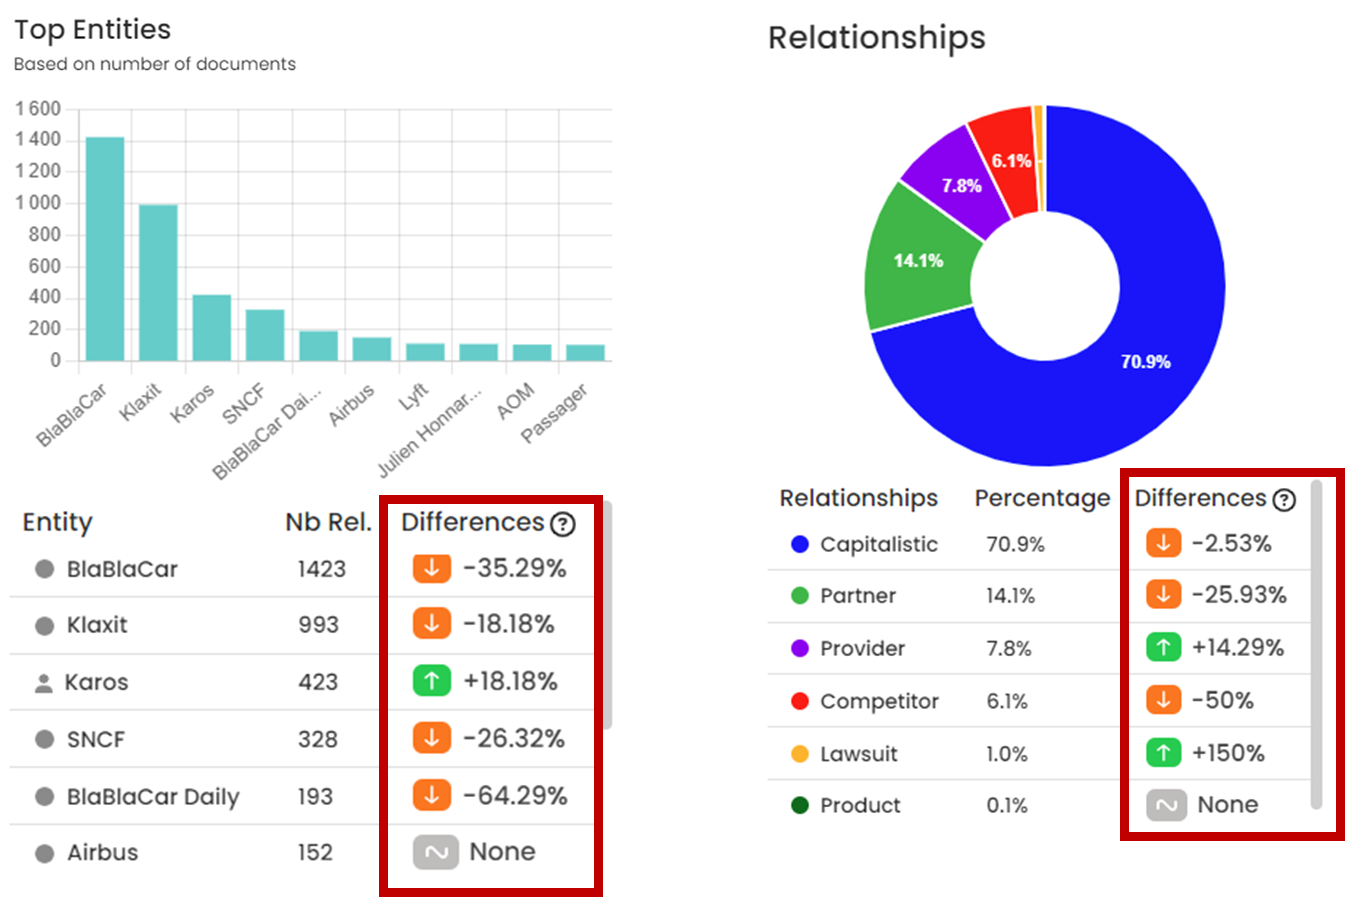
When you hover over the coloured arrows, the number of documents linked with the actor or relationship is shown concerning of the current monitoring step and the number of documents collected during the previous monitoring step.