
Why compare the volume of communication of actors with the size of their ecosystem?
The volume of communication is the number of documents that mention a player, as opposed to the size of its ecosystem, which corresponds to the number of relationships it has with other entities of all kinds. Comparing these two data allows us to identify highly communicative players with a rather weak ecosystem: they are often new players on the market, they are disruptive but have not yet established many links with other entities. Players with a large ecosystem but little communication are usually historical players who have already built up a network and no longer need to rely on communication as much because their position is already established.
1. Identify the 10 actors with the most important ecosystems
In your "Relationship" filter, select all relationships and deselect the "other" relationship to display only active relationships. Open your "actor" filter and identify the top 10 actors in the list, which are ranked by decreasing number of relationships (which are shown in grey to the right hand side of each actor name). Using this data you can easily create a bar.
2. Identify the 10 most communicative actors
Go to the "Top 25 key facts" table in your Dashboard, which gives you a list of actors and the number of documents that mention them. The actors are ranked by number of mentions in documents in decreasing order. By identifying the top 10 and their number of associated documents, you can create the same type of bar chart.
Tips :
If, among the top 10 actors with the largest ecosystem and communication, you identify entities that do not interest you (technology, products, government actors, etc.), ignore them and identify only the 10 actors that can be compared (private companies for example).
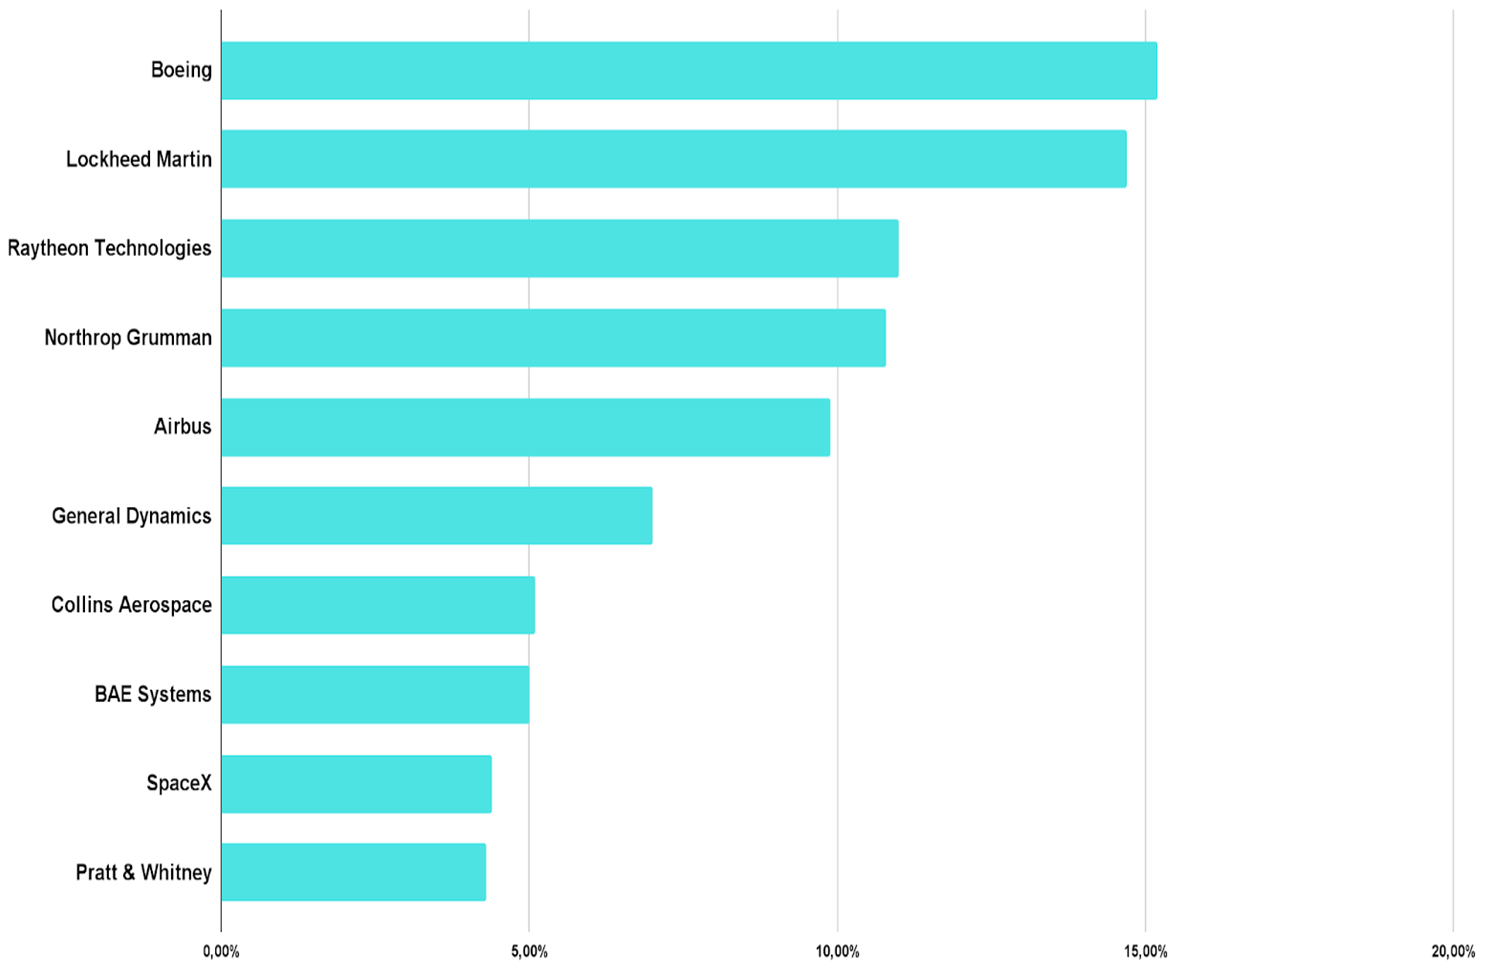
Communication volume of the Top 10 players
Finally, you can combine your two graphs by giving two colors to your different bars (communication vs. ecosystem) so that the analysis is easy and you can easily identify disruptive or historical players for example.

The second option is to create a position graph with the volume of communication on the x-axis and the size of the ecosystem on the y-axis.
